Compass

Compass Agent Search

Goal
Address low adoption of search and inventory capabilities.
Role
Principal designer. IC work, plus managing the Search and Inventory team of 4 designers. Reported to the CPO.
Approach
Redesign the system to accommodate agents' previously learned behavior, and regional discrepancies.
Outcome
Increased adoption in every region it was implemented. In DC, daily search use rose over 30% after launch.
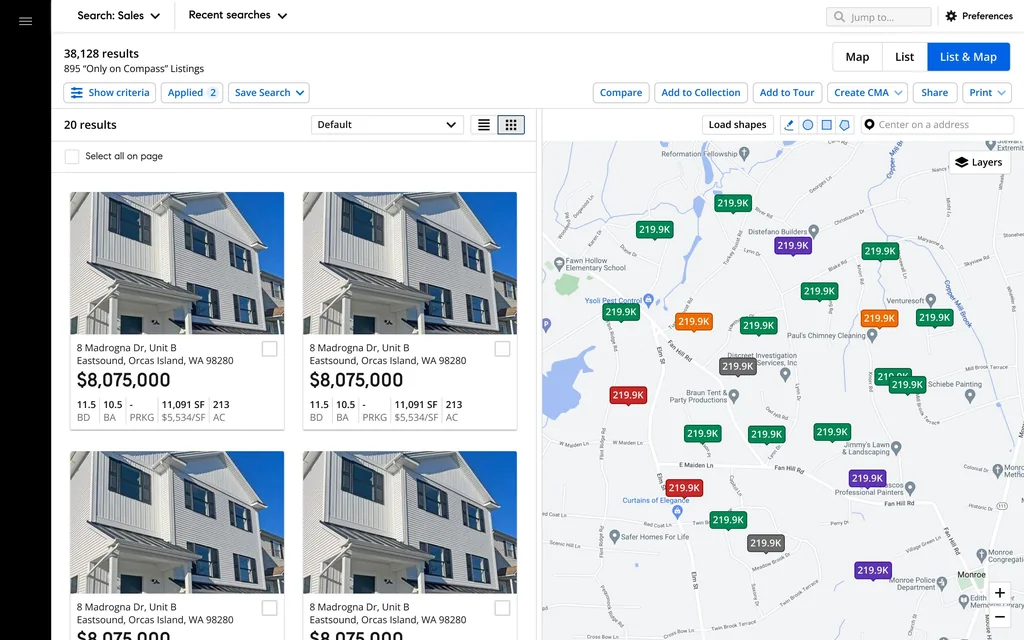
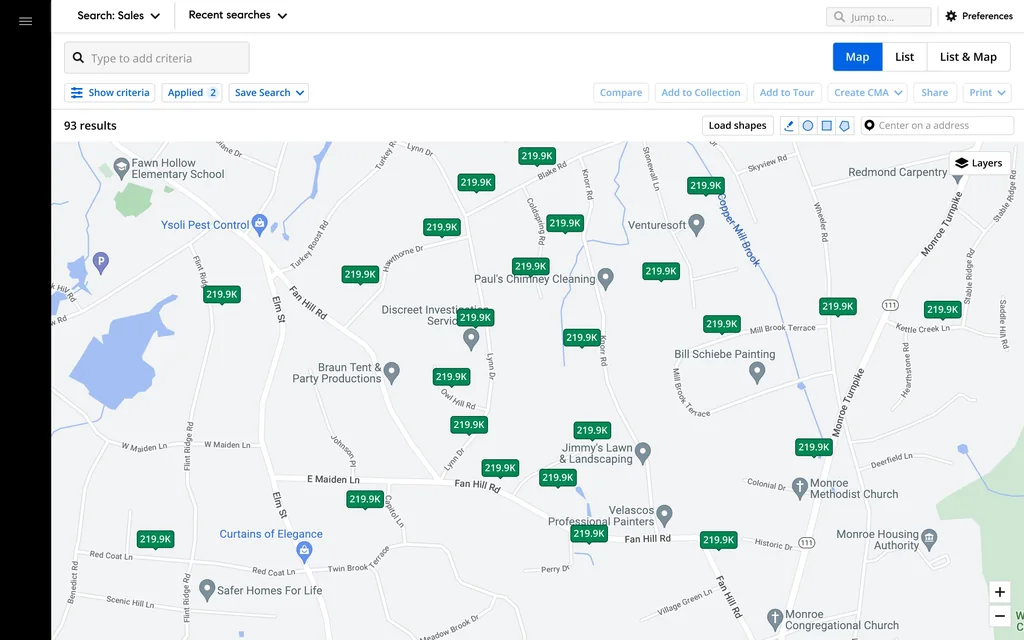
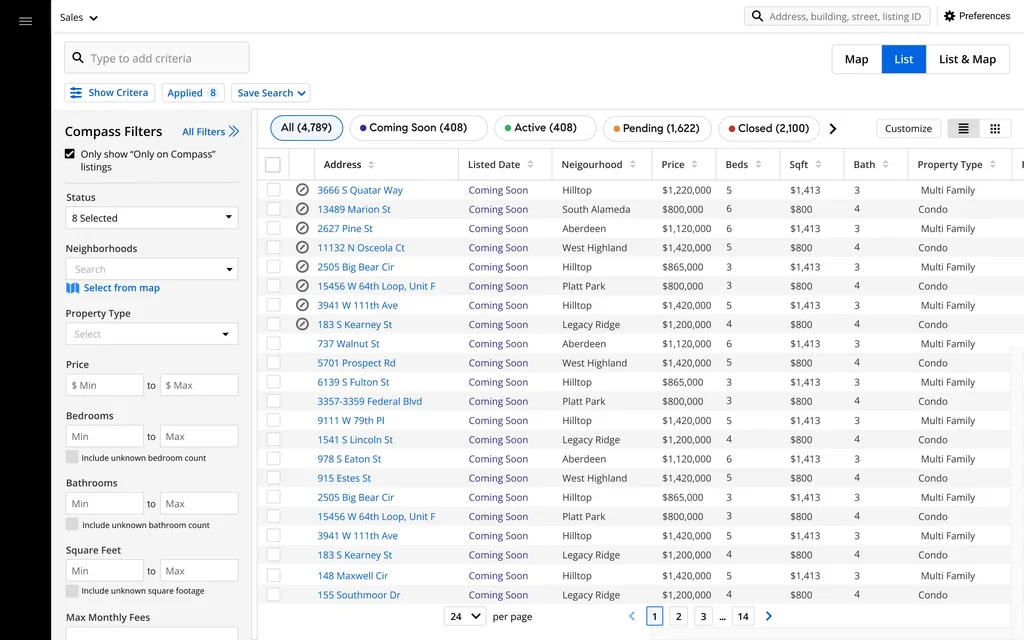
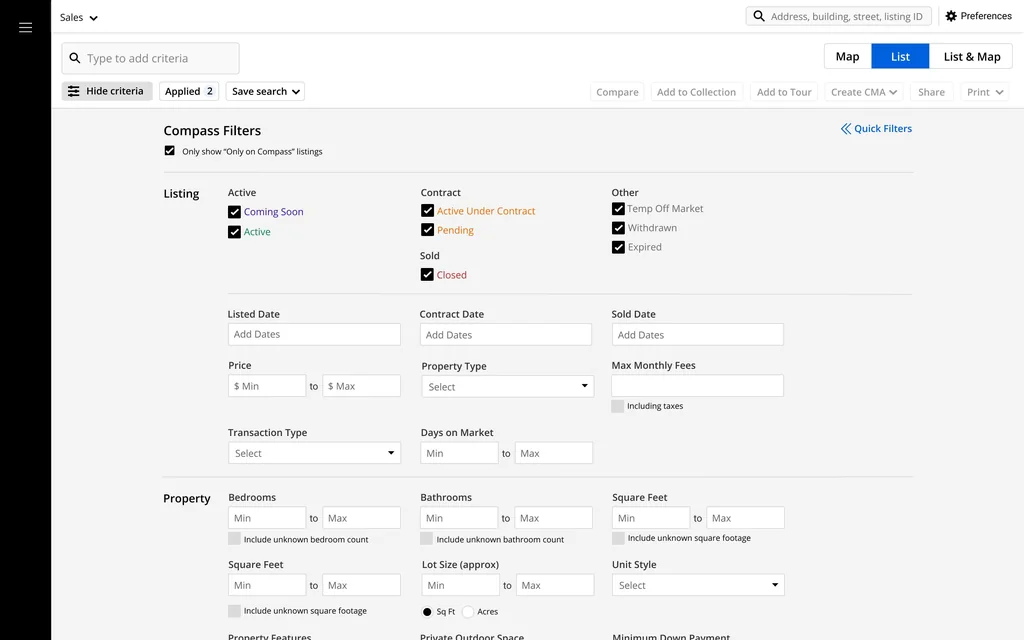
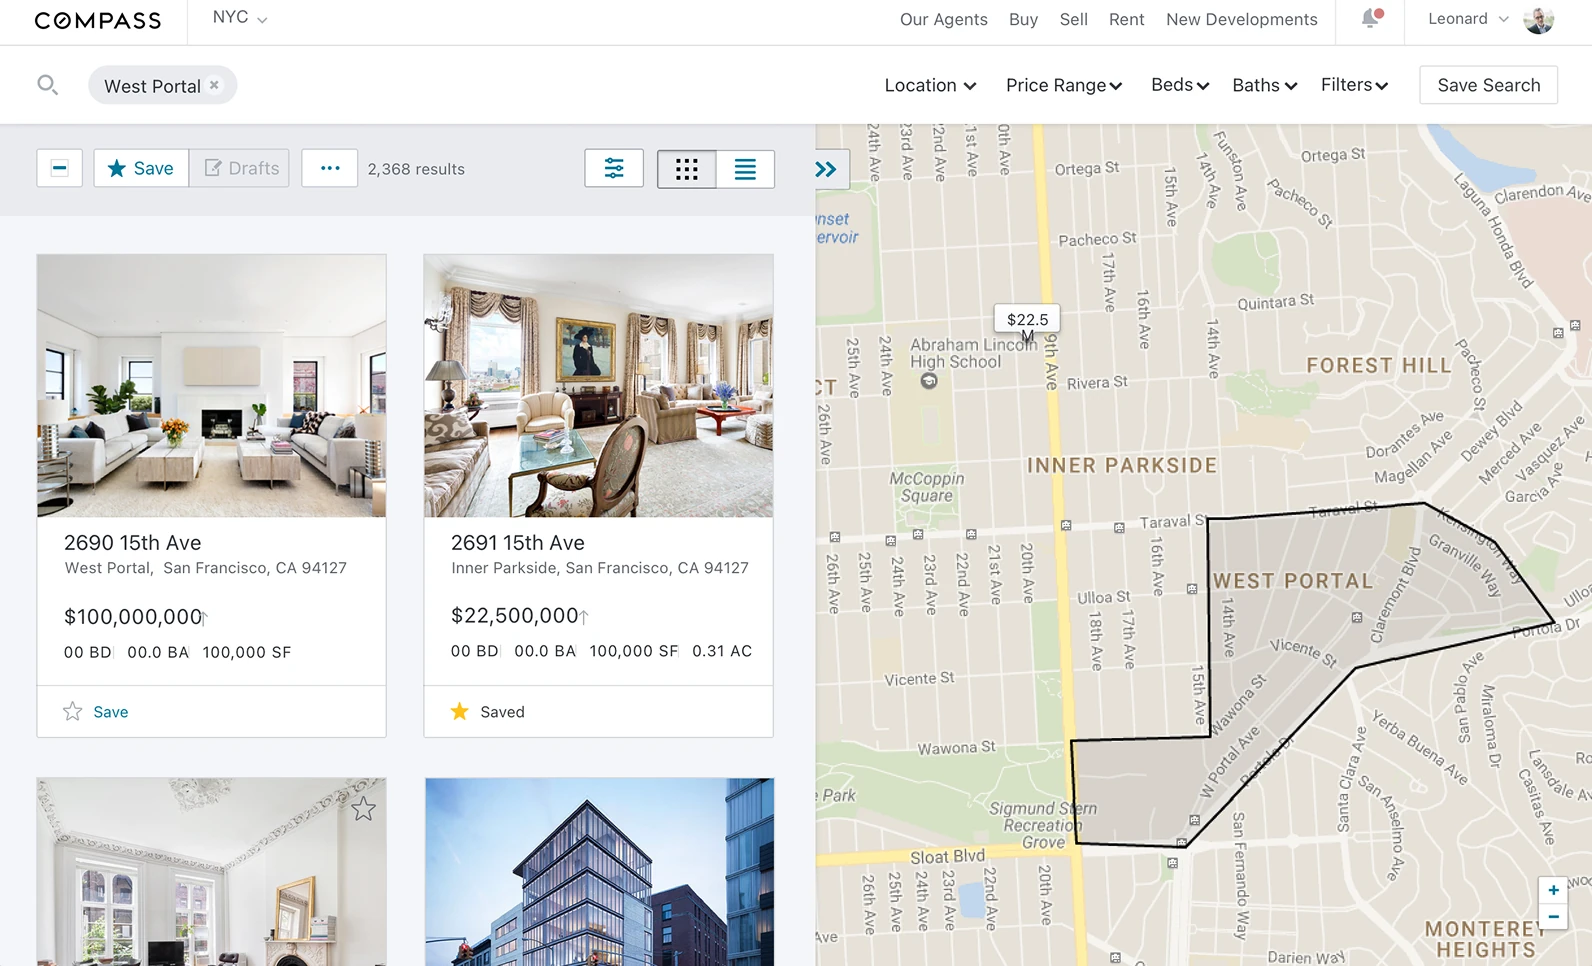
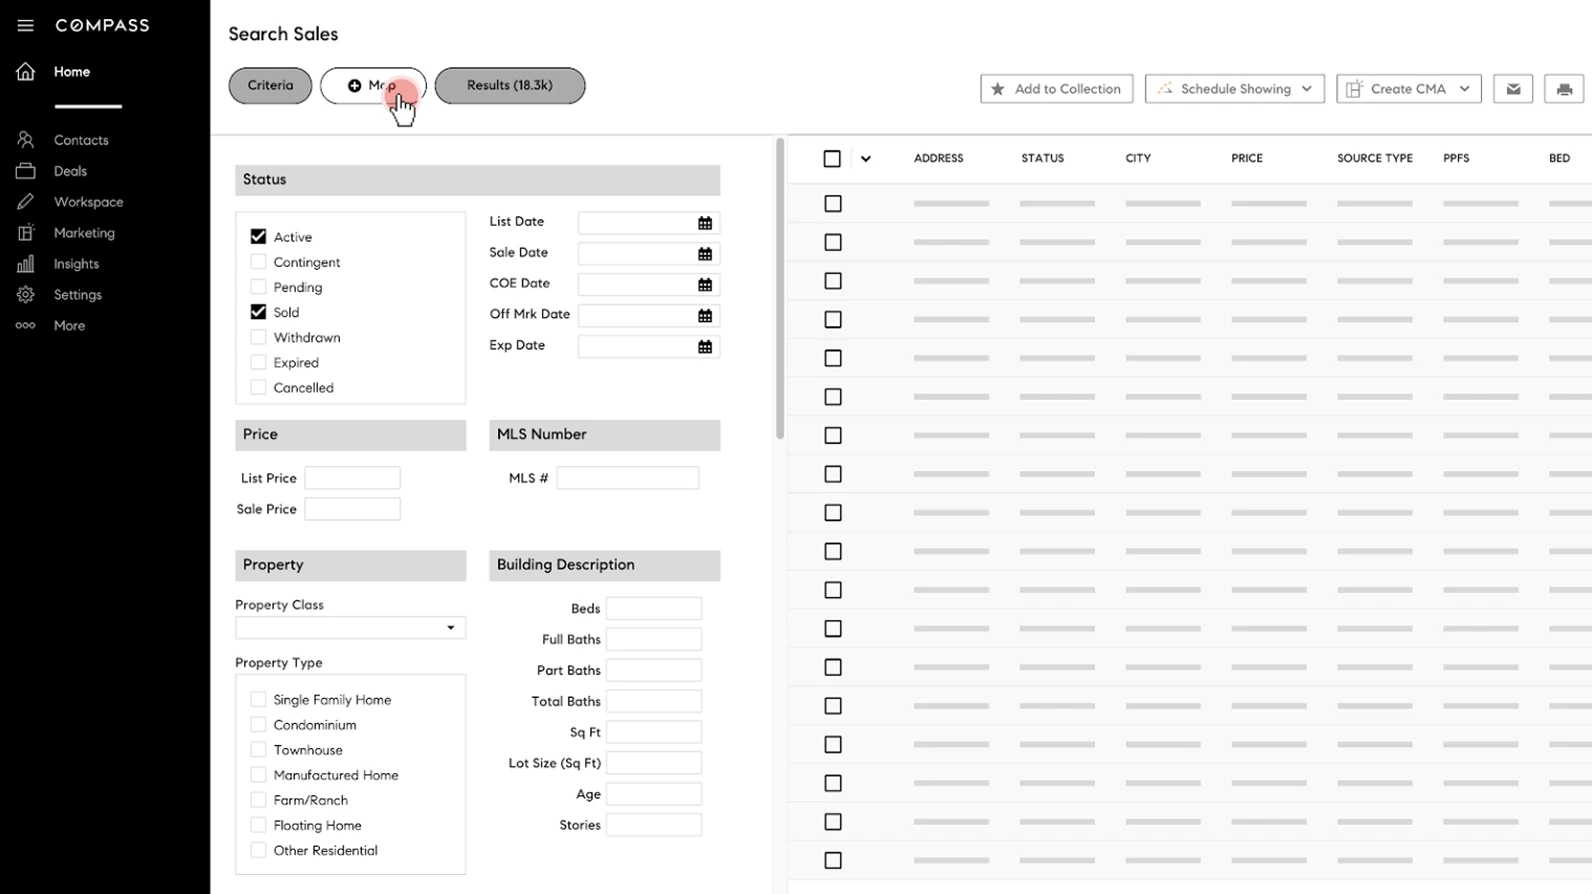
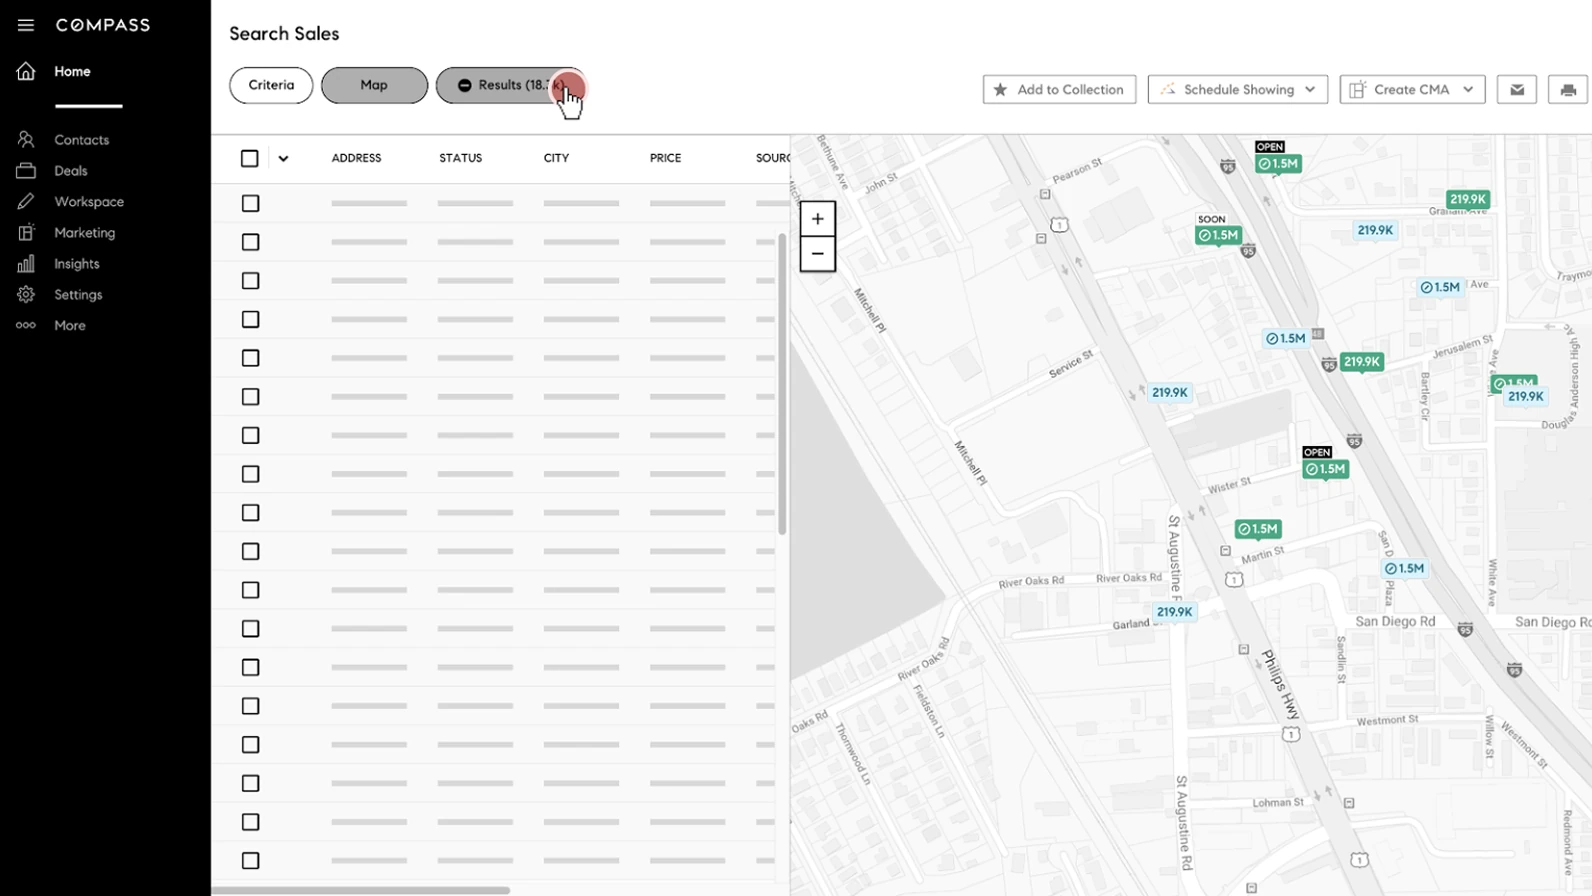
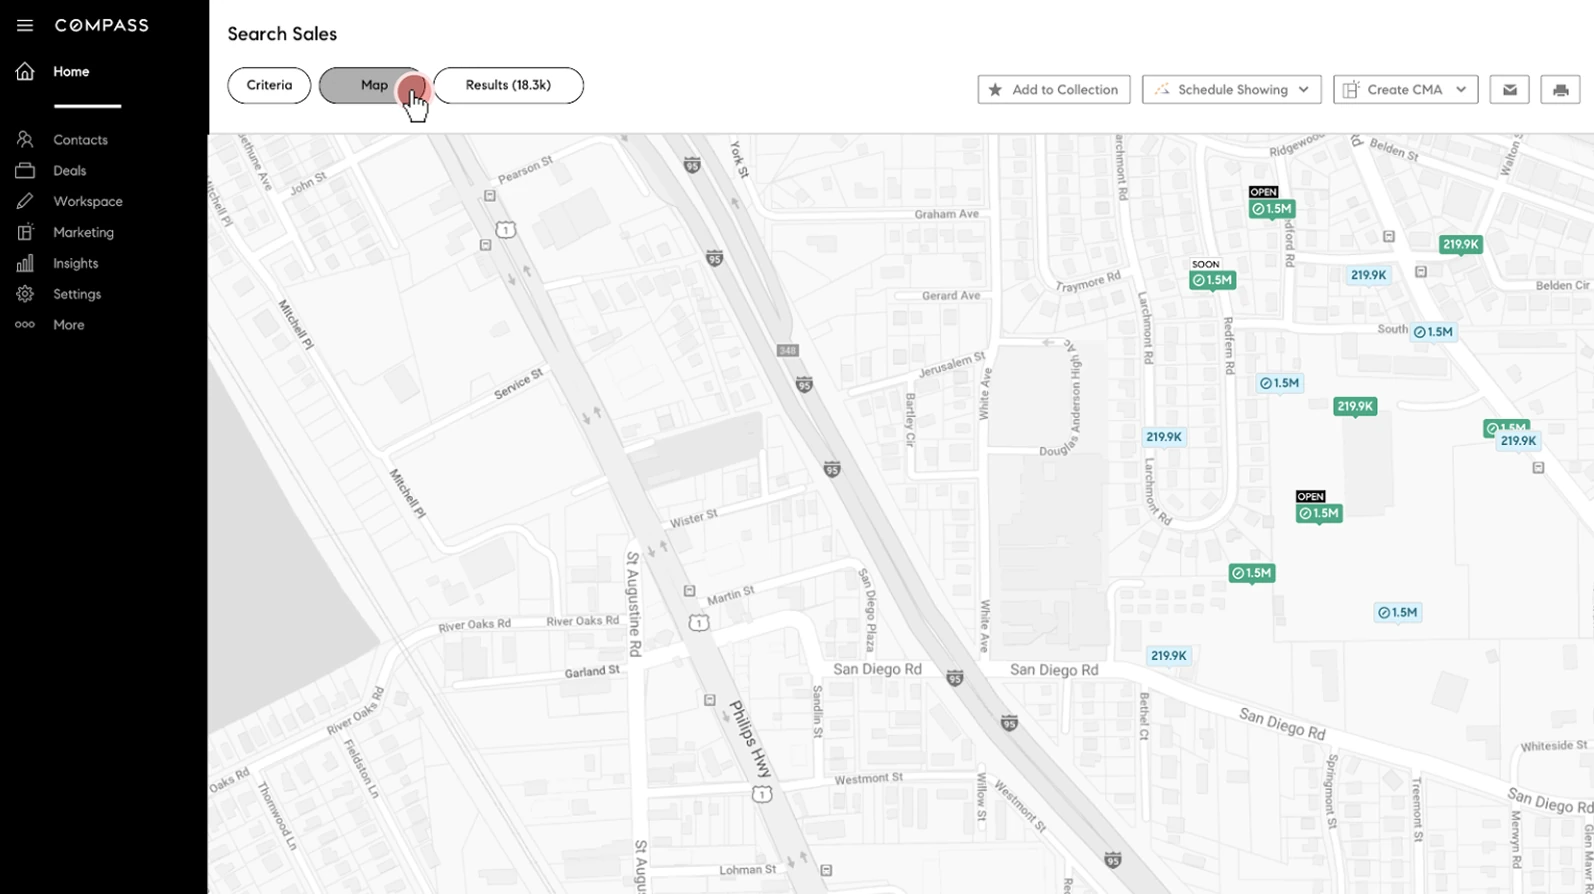
Compass agent search: listing cards beside a map of priced pins, with criteria, saved searches and actions aboveCompass agent search as a full map of priced pinsCompass agent search as a table of listings with the filters at its sideCompass agent search with the full criteria panel open

The problem

Agents learned to search on their regional MLS. The Compass agent search was built off of the consumer experience instead.

That gap between their mental model and the product caused errors in how they input search criteria. The queries were incorrect, the results unexpected, so they kept going back to the MLS and missed out on the Compass core features.

And because search is the gateway to all other agent workflows, those workflows were starting on other platforms.
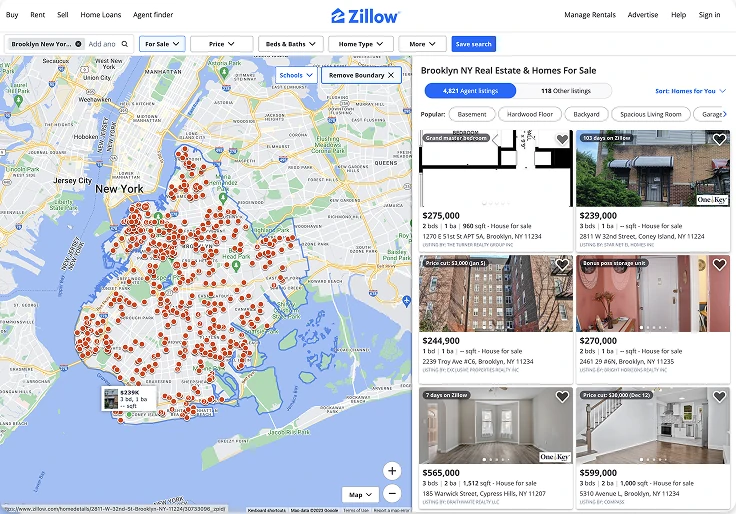
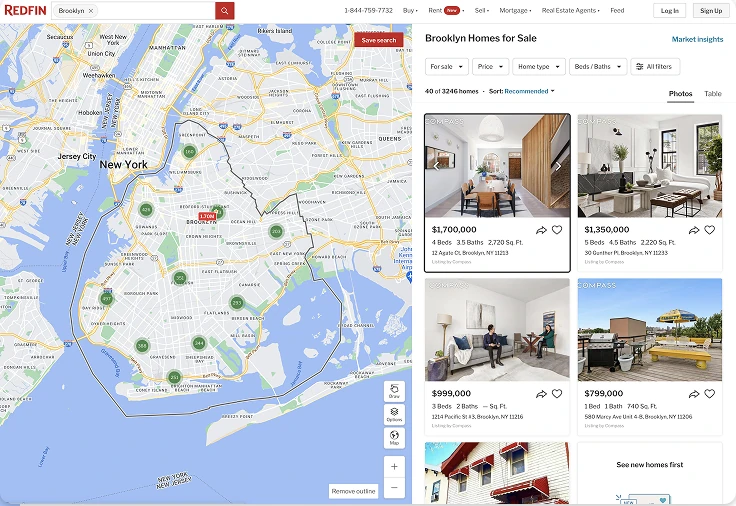
Consumer
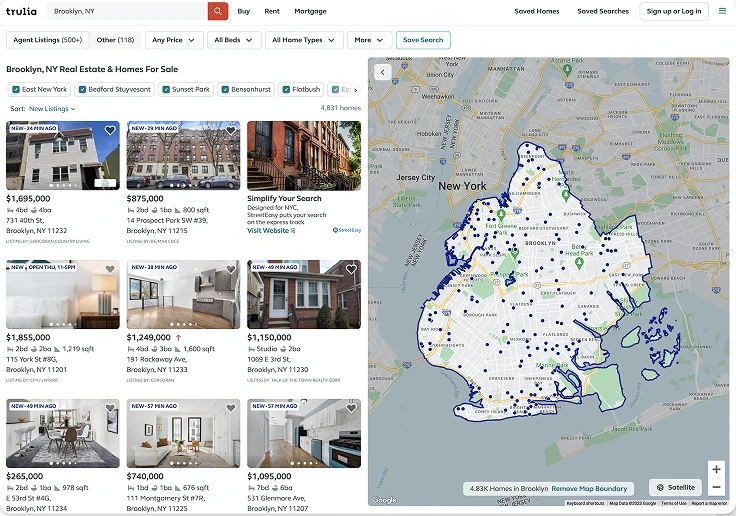
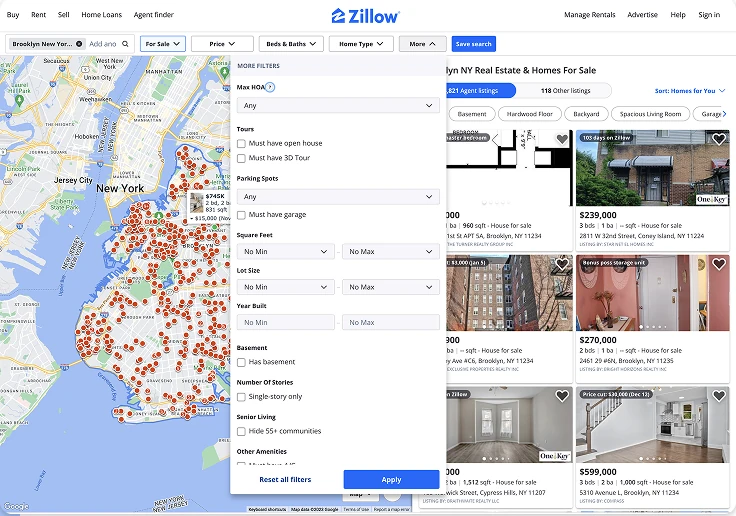
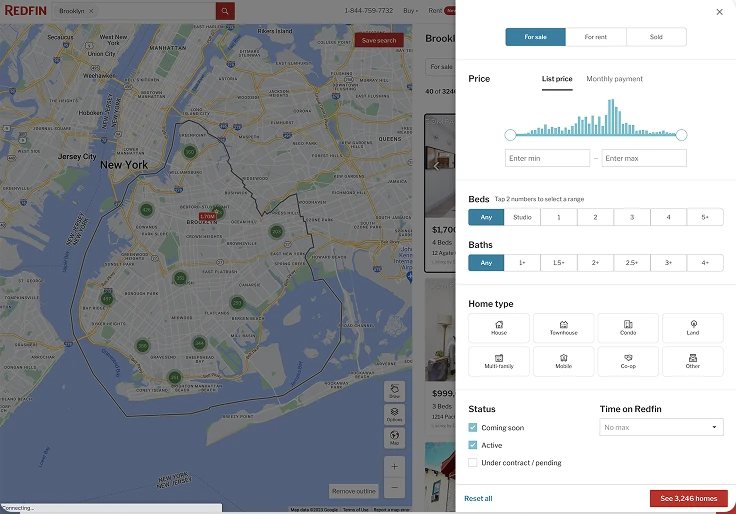
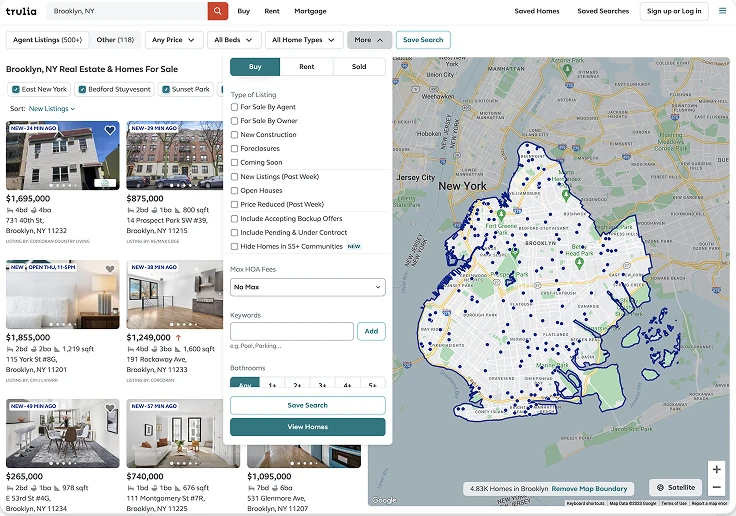
ResultsZillow search results: a map of Brooklyn beside listing photosRedfin search results: a map of Brooklyn beside listing photosTrulia search results: listing photos beside a map of Brooklyn
FiltersZillow filters: a short menu of options over the mapRedfin filters: a side panel with price, beds, baths and home typeTrulia filters: a short menu of checkboxes over the results
MLS
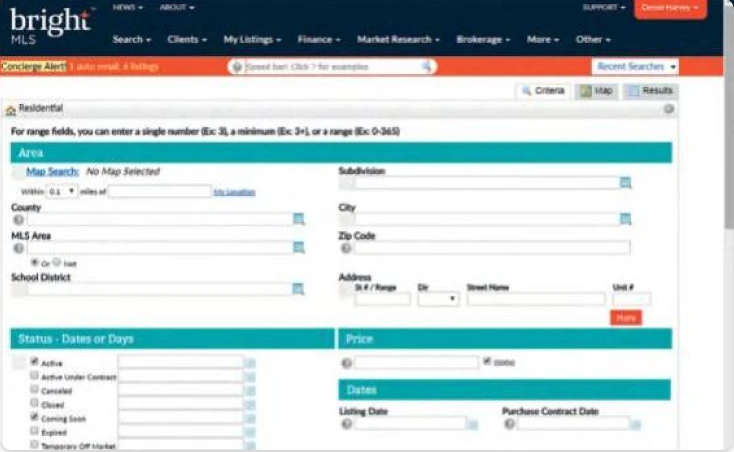
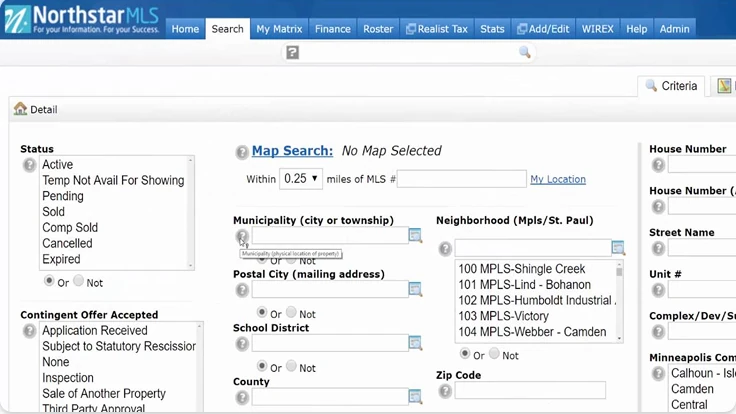
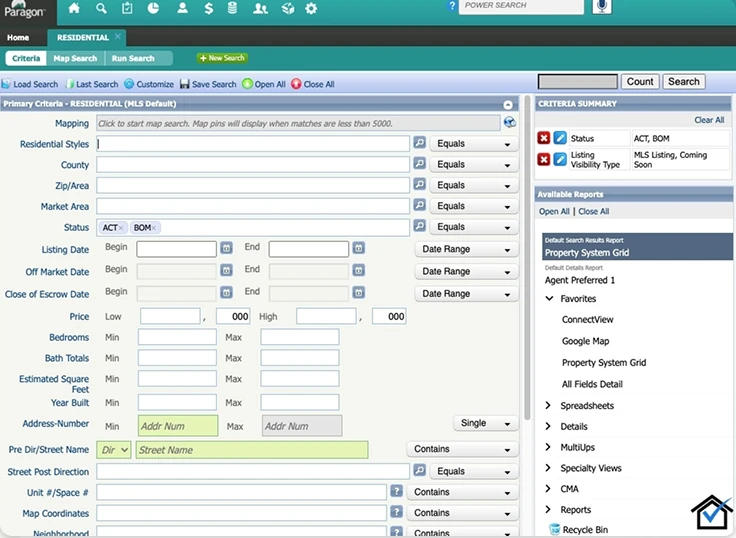
FiltersBright MLS search criteria: a dense form of fields and checkboxesNorthstar MLS search criteria: lists, fields and And, Or, Not switchesParagon MLS search criteria: a long form of fields with operators
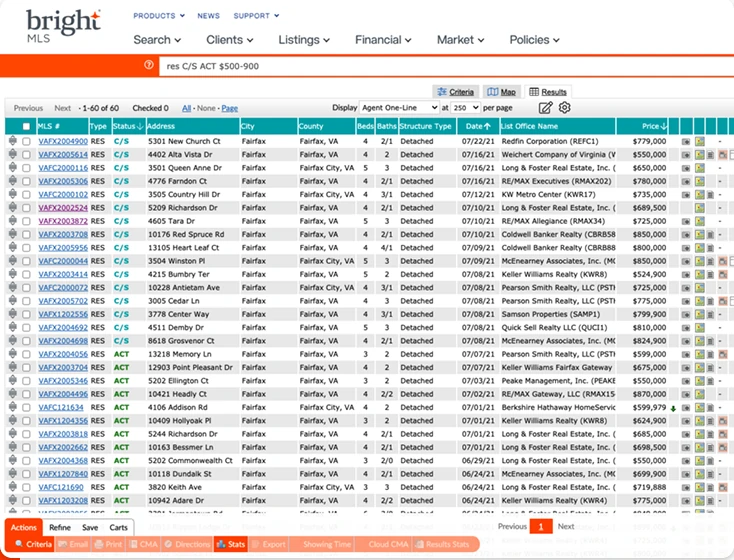
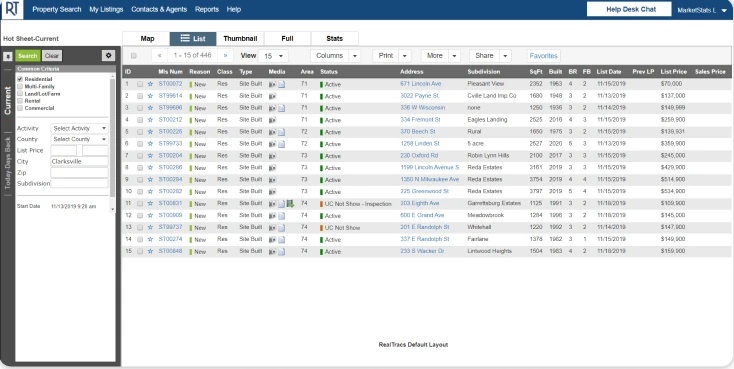
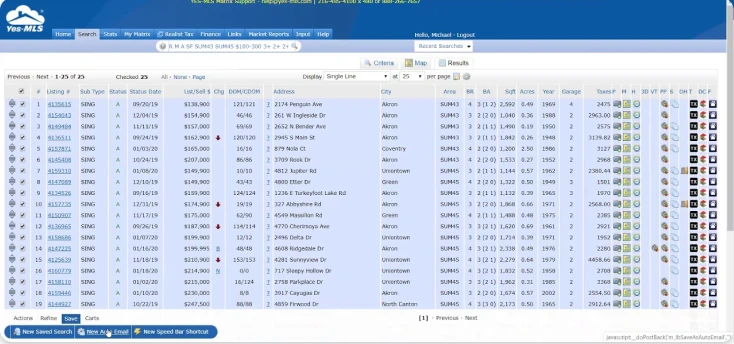
ResultsBright MLS results: a dense table of listingsRealTracs results: a table of listings with a criteria panelYes-MLS results: a dense table of listings
Whether intentional or not, the MLS systems were designed in rather consistent ways, unlike a normal consumer facing search experience.
Zillow search results: a map of Brooklyn beside listing photosRedfin search results: a map of Brooklyn beside listing photosTrulia search results: listing photos beside a map of Brooklyn
The earlier Compass agent search: listing photos beside a map, a search bar with a few dropdowns, like the consumer sites
Uh oh. The Compass agent search experience was built off of the consumer experience. It even shared the same codebase, making it hard to operate independently.
Paragon MLS search criteria: a long form of fields with operatorsBright MLS search criteria: a dense form of fields and checkboxesNorthstar MLS search criteria: lists, fields and And, Or, Not switches
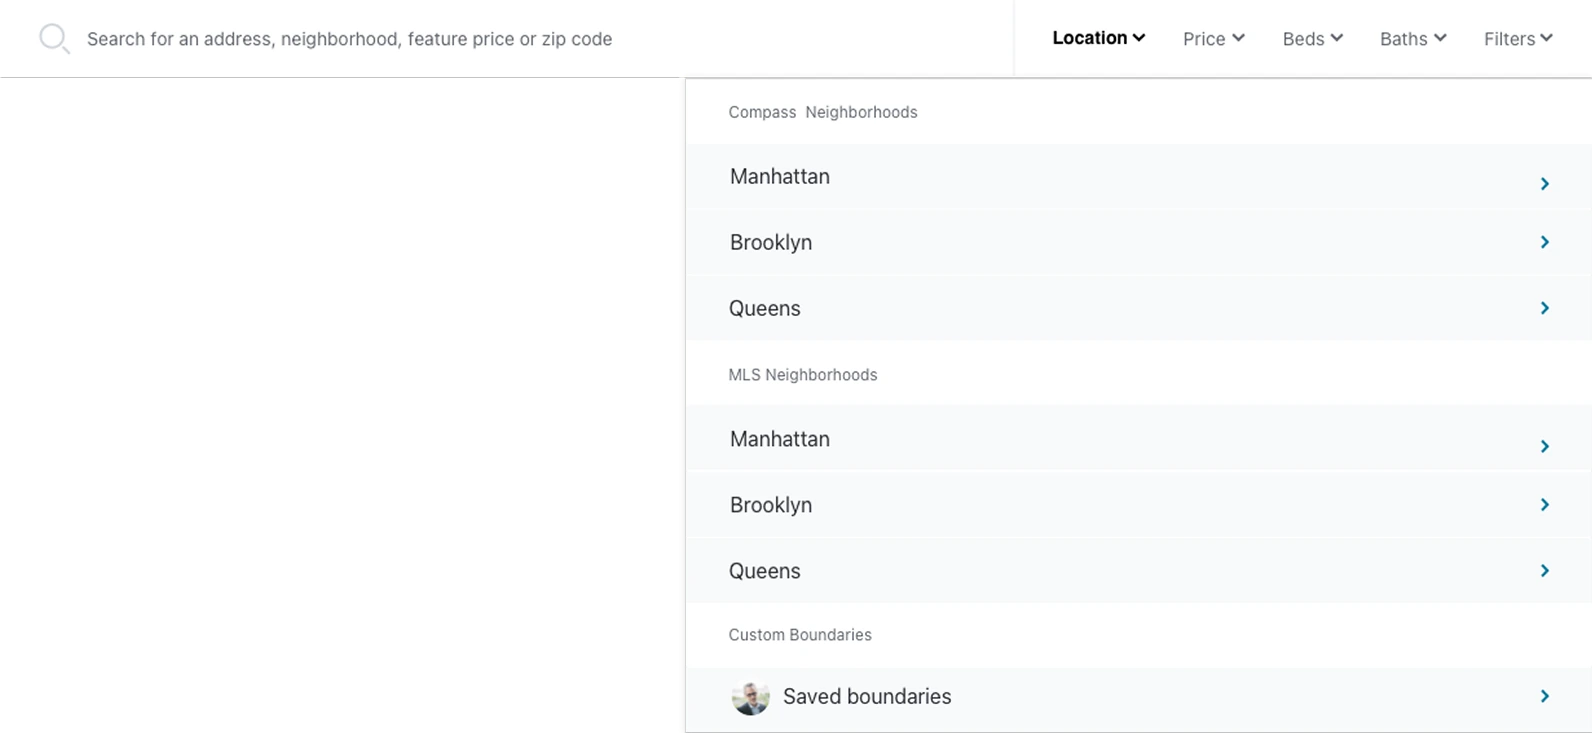
The earlier Compass search bar: one text field, a few dropdowns, and a location menu of neighborhoods
The forms agents knew, and the search bar they were given. As a result, the queries were incorrect, causing them to retrieve unexpected results.
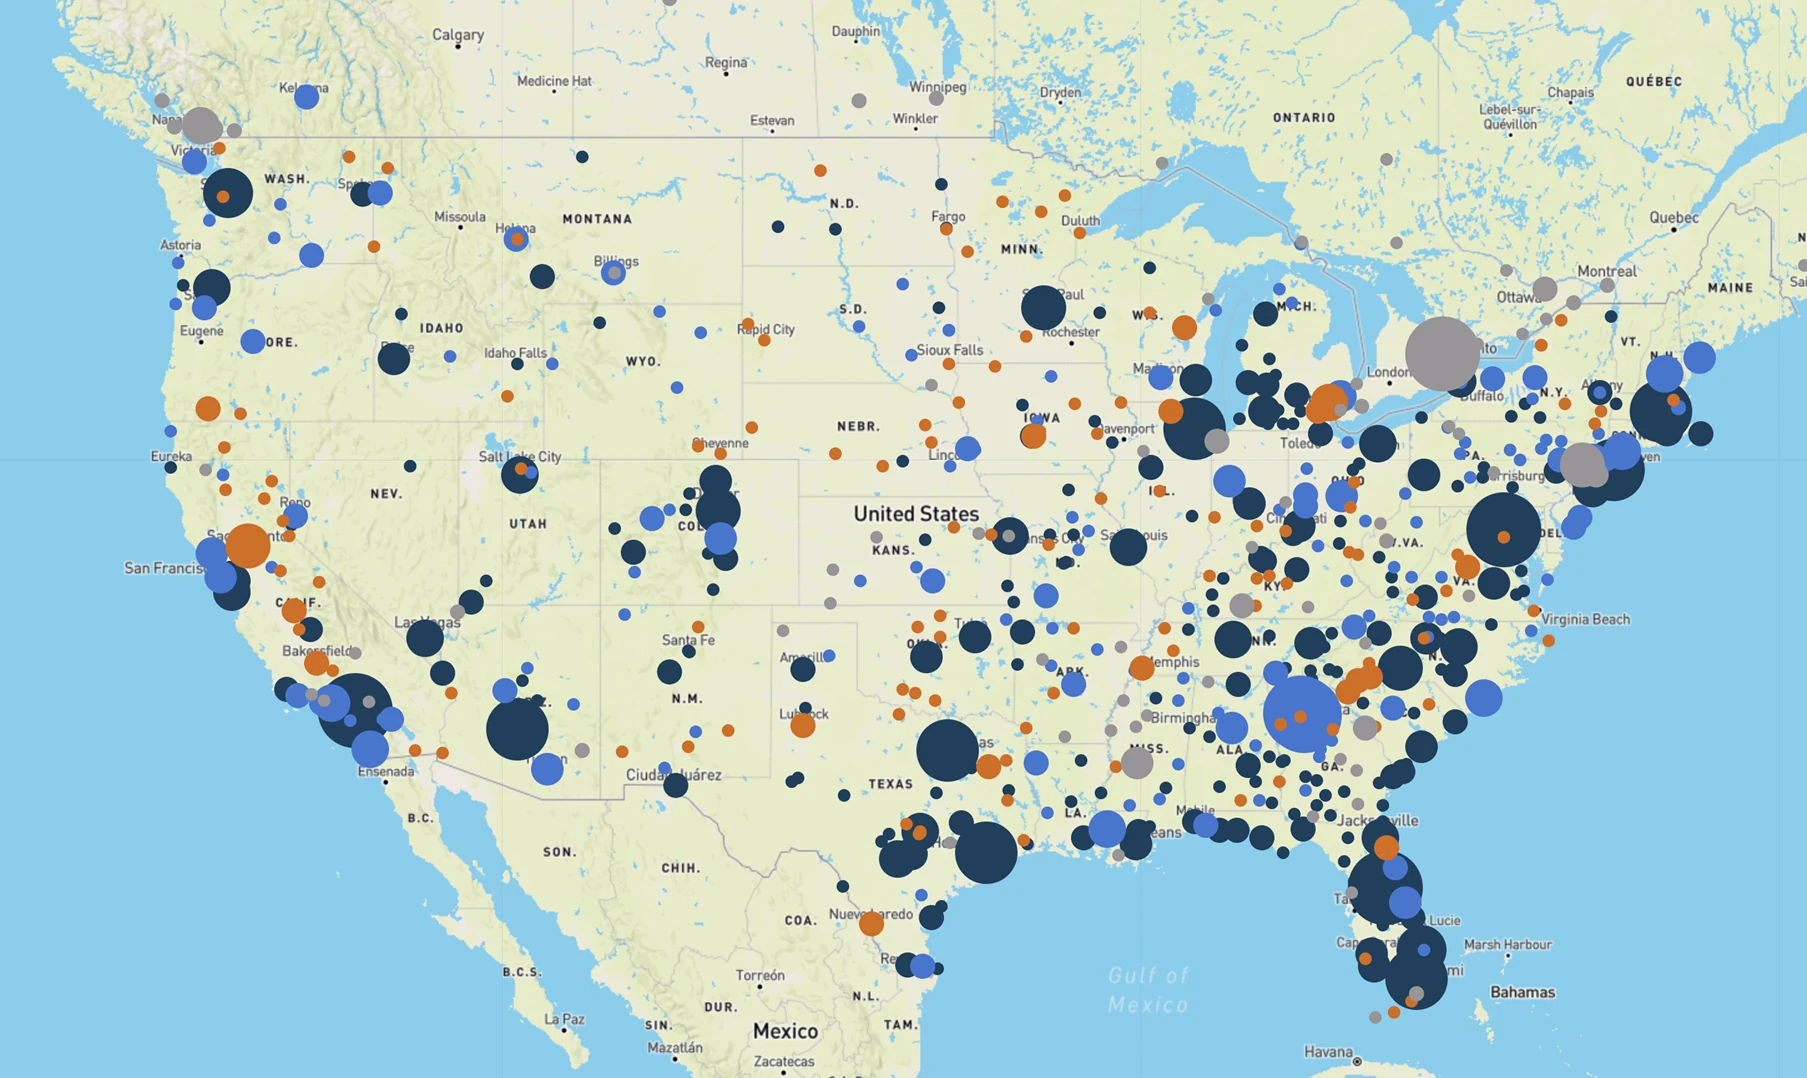
A map of the United States covered in dots, one per MLS
There are 597 MLSs in the United States, each with its own criteria.

The approach

We started by listening. In 2018 we flew to SF for a research session with local agents. We learned that agents expect search to work like the tools they already know. And those tools change by region: New York agents were used to typing into one box, everywhere else to filter forms.

So the idea was to stop bending a consumer search to fit agents, and design around how they already work. I wrote it up as a design vision, plus a framework that broke the work into parts we could research, design, and build.

The team and I pitched that vision to the CEO, COO, and CPO. It was approved, funded, and became the largest project in the roadmap.

Four people smiling for a selfie by the water in San Francisco
2 PMs, a researcher and a designer sat at a bar...
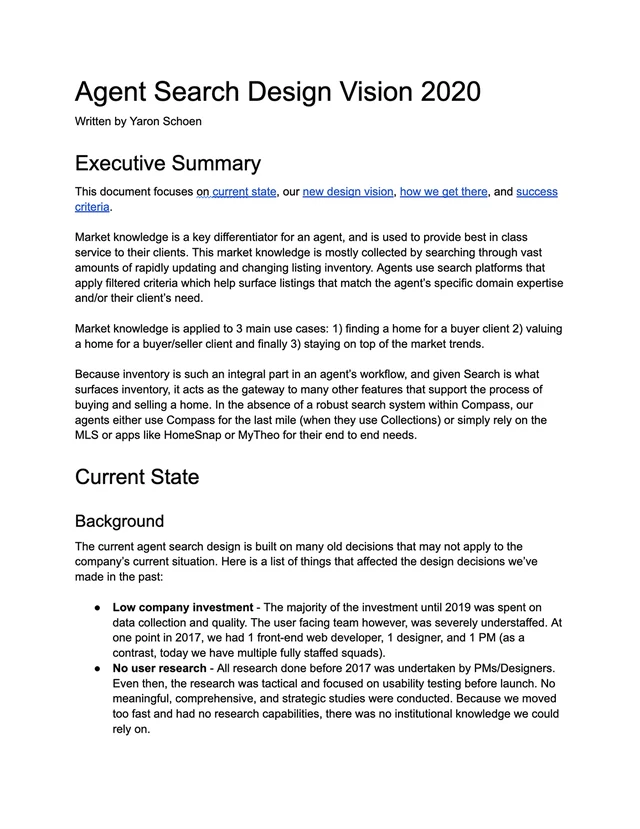
The first page of a document titled Agent Search Design Vision 2020, written by Yaron Schoen
The design vision: an inventory platform that makes surfacing relevant listing data, and taking action on it, flexible enough to accommodate every imaginable agent workflow, user preference, and regional need.
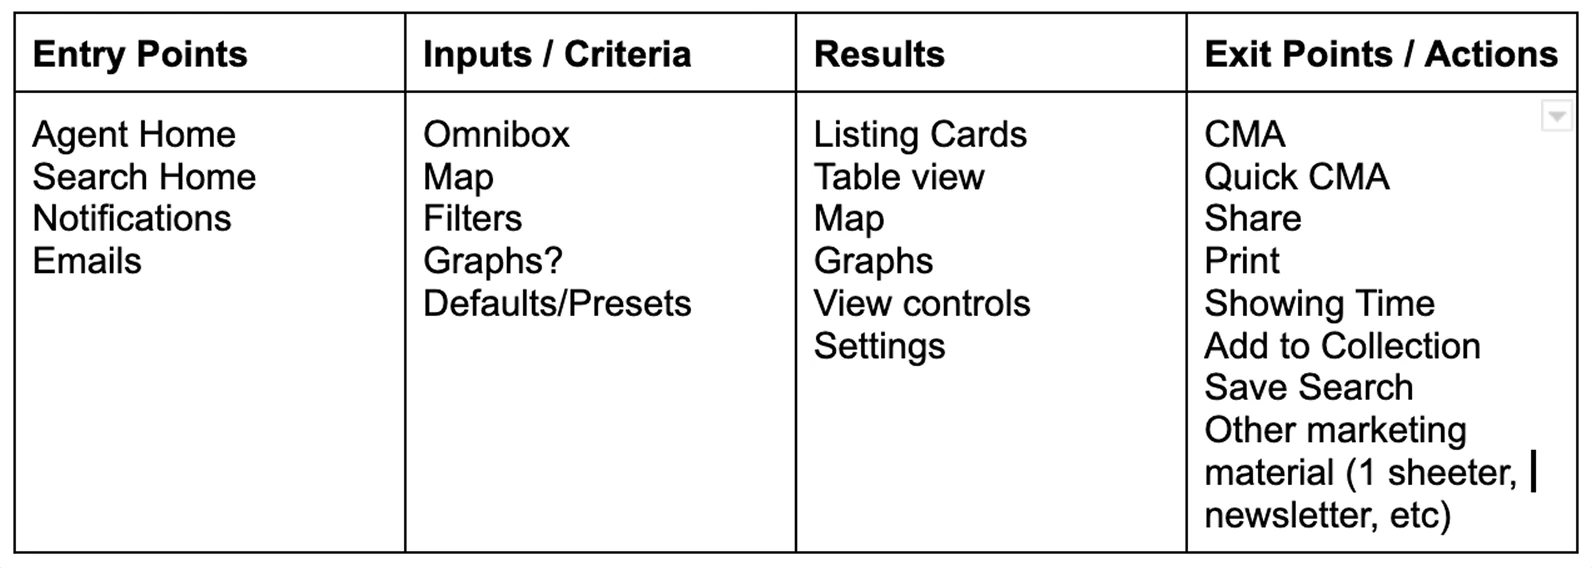
A table of four columns: entry points, inputs and criteria, results, exit points and actions
So many unknowns, we needed a framework in which we can uncover them. It divided the experience into groups that could be researched, designed, and built: entry points, criteria, results, and exit points.
A flow diagram: a workflow leads to an entry point, then criteria and results, which feed each other, then an exit into actions. An agent's region and preferences, and the workflow itself, shape both criteria and results.WorkflowEntryPointCriteriaFiltersMapResultsCardMapListExit /ActionsAgent RegionAgentPreferences
How the parts connect: a workflow leads to an entry point, criteria and results feed each other, and it all ends in an action. An agent's region and preferences shape every step.
A low fidelity wireframe: search criteria beside a results tableA low fidelity wireframe: a results table beside a mapA low fidelity wireframe: the map alone
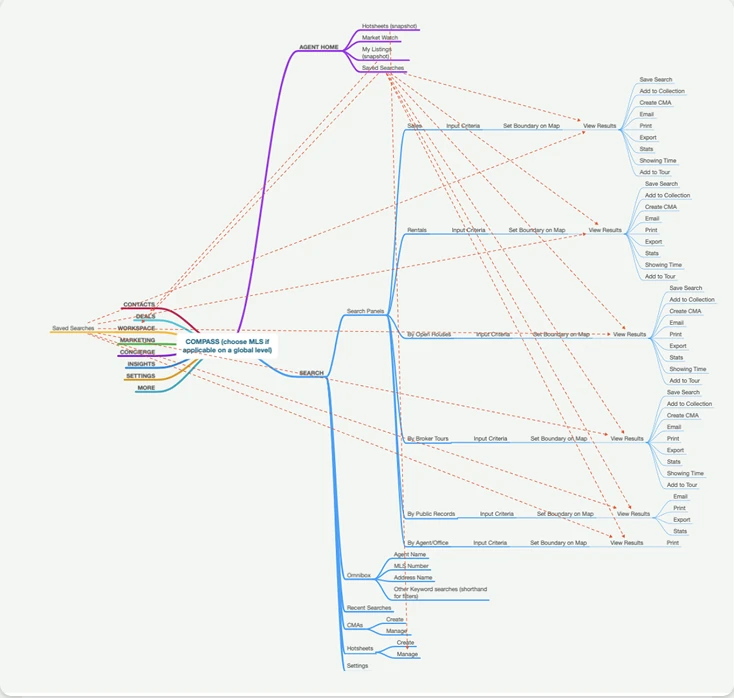
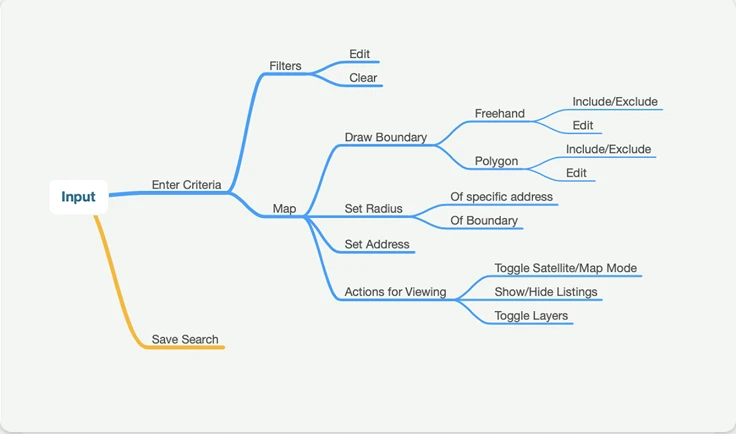
A flow map of the whole search area and how its parts linkA flow map of the input branch: criteria, filters, map tools, save search
The framework as flows and wireframes: entry, criteria, results, actions, exit.

Filters first

The framework gave us four parts to work on. I suggested starting with filters, because that's how agents input their queries. If they can't ask the question their way, they won't see the right results.

The catch: the 597 MLSs had tens, even hundreds, of different filters each. One consolidated UI that accounted for all of them was impossible at the time.

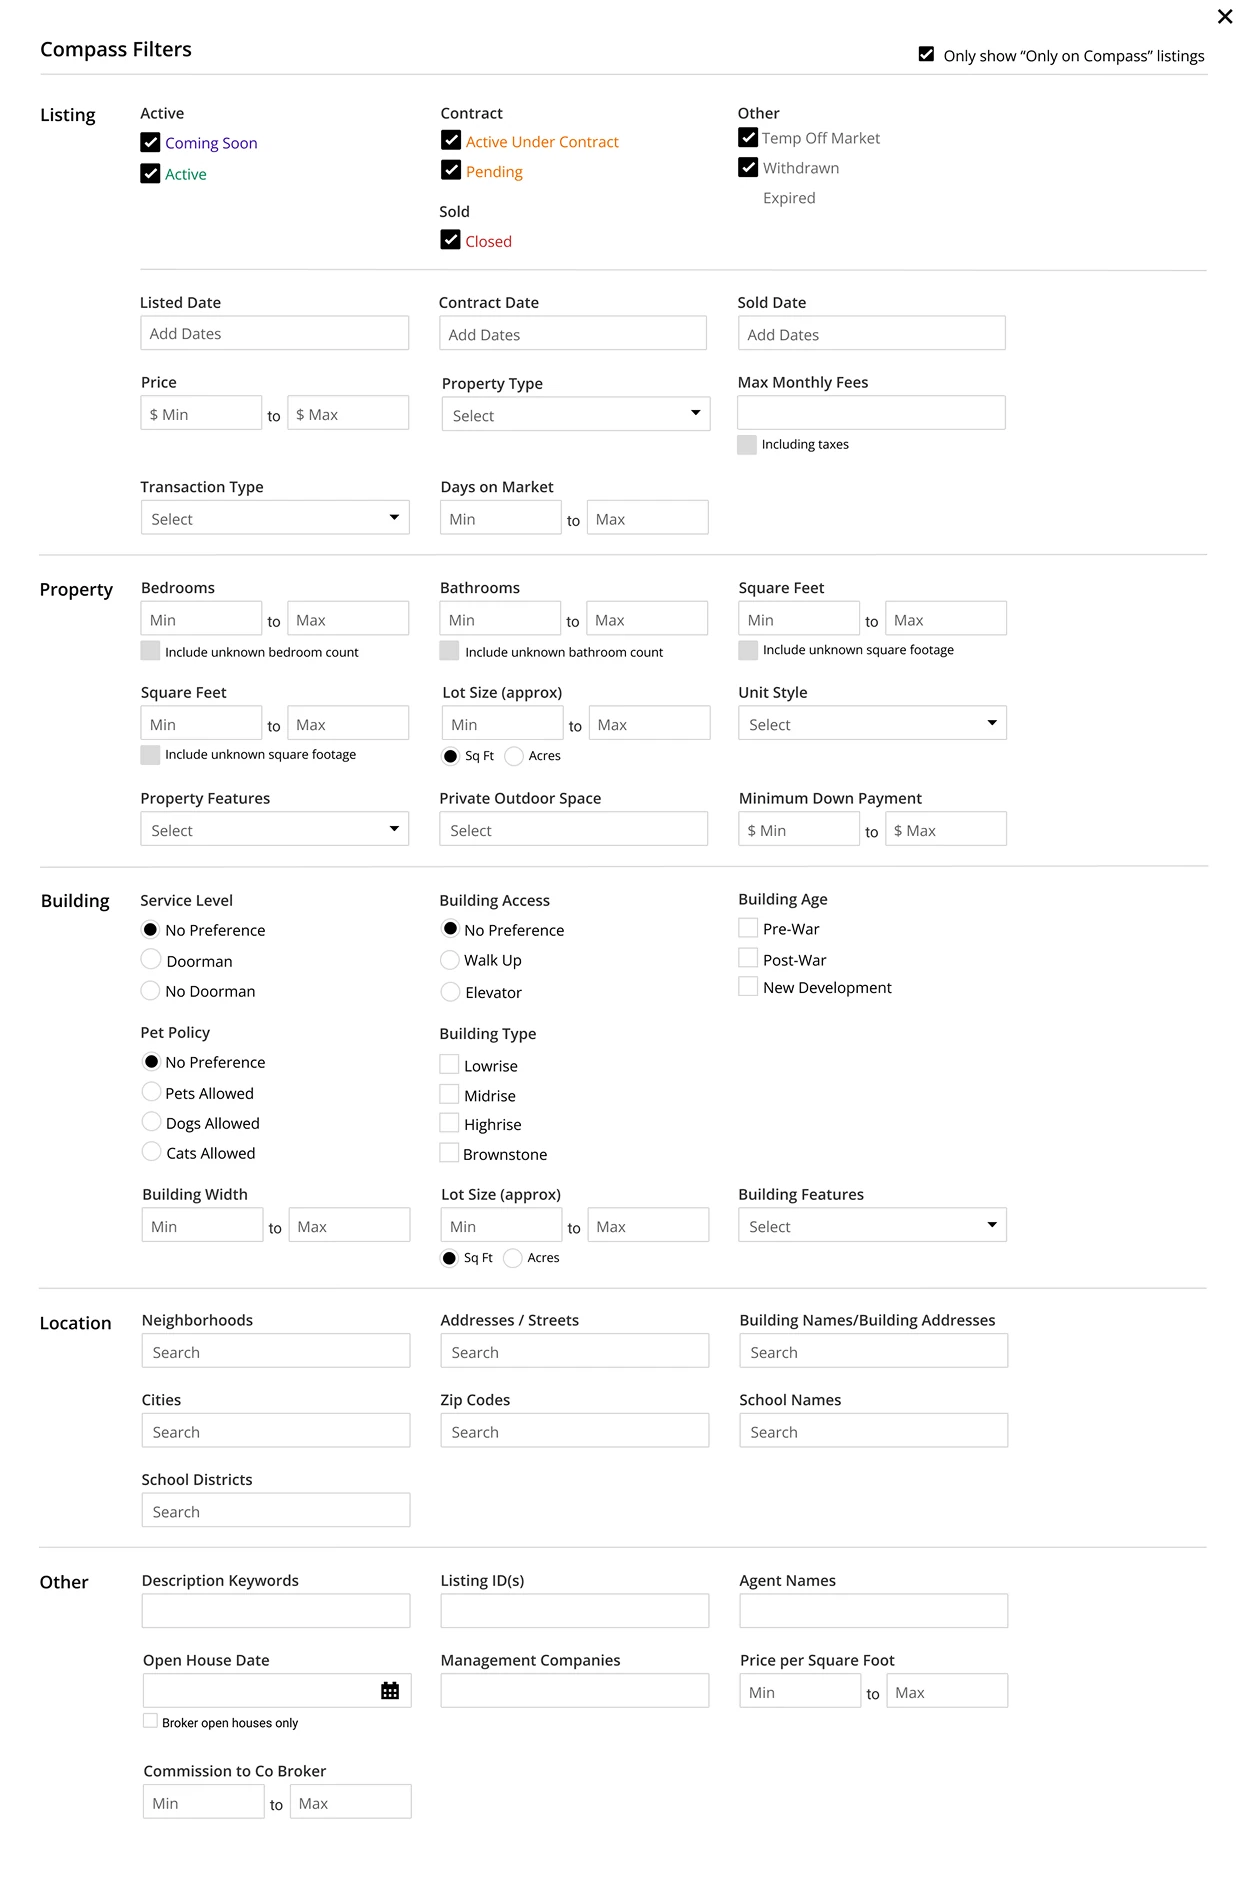
So I proposed the opposite: replicate the filter panel per region, with labeling, grouping, layout, and interactions similar to the MLS. Agents' mental models were just too hard to break, so we designed for them instead. We launched region by region, starting with Boston.
Paragon MLS search criteria: a long form of fields with operatorsBright MLS search criteria: a dense form of fields and checkboxesNorthstar MLS search criteria: lists, fields and And, Or, Not switches
The Compass filters panel, grouped into listing, property, building, location and other, laid out like an MLS form
Three of the 597, each with its own filters, its own labels and its own layout. The Compass filter panel: labeling, grouping, layout, and interactions similar to the MLS. Agent wayfinding improved.
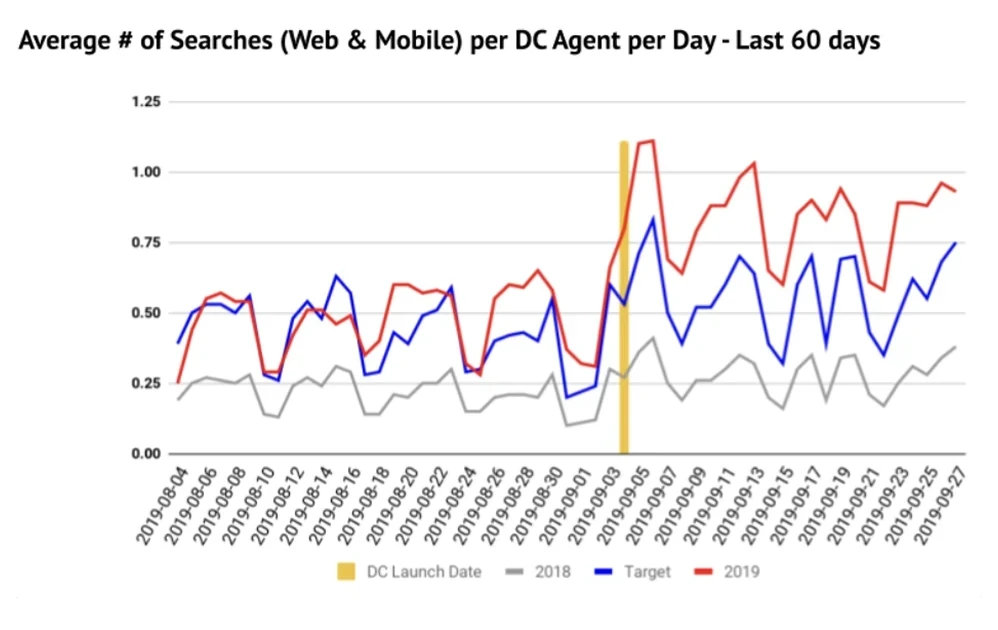
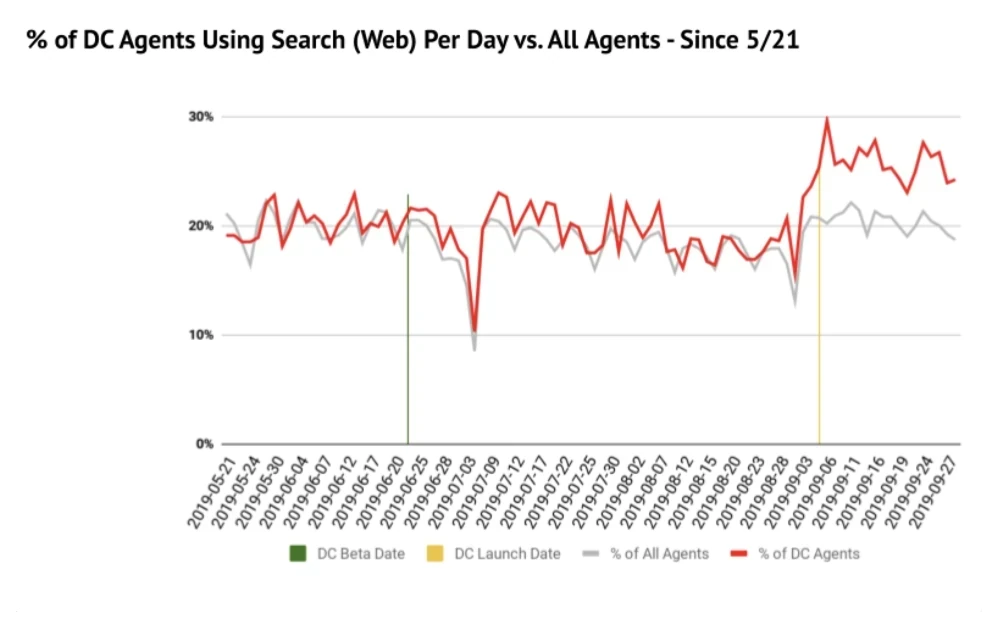
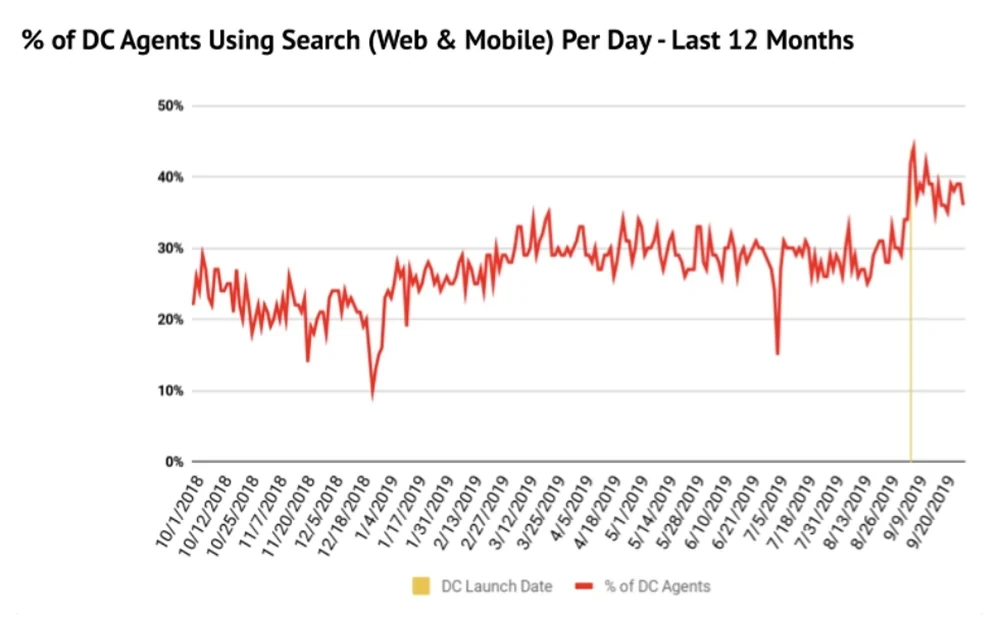
A line chart: the share of DC agents using search per day over twelve months, jumping after the launch dateA line chart: average searches per DC agent per day against 2018 and a target, rising above both after the launch dateA line chart: the share of DC agents using search per day against all agents, pulling away after the launch date
The DC launch: daily search use up by more than 30% while the rest of the company stayed flat, and searches per agent up by roughly 70%, above target. It was a huge success, prompting the company to significantly increase headcount focused on filters.

Draw the rest of the owl

This was a huge project, so I'll stop the case study here, before it turns into a book. Get in touch if you want the long version.

But with the filters in, the rest of the framework followed: results, customization, and the exit points into an agent's other workflows.

The experience was implemented in all regions on a rolling basis through user feedback and iteration, and adoption increased in every single one. In DC, daily search use rose by more than 30% in the weeks after launch, and searches per agent by roughly 70%.

The shipped search screen with four labels: query inputs point at the search menu and the criteria button, exit points at the row of actions, customization at the view switches, results at the listing cards and the map
The framework on the shipped screen: query inputs, results, customization, and exit points.
Compass agent search as a full map of priced pinsCompass agent search as a table of listings with the filters at its sideCompass agent search with the full criteria panel open
The map view, the list view, a table like the MLS with the region's filters at its side, and the full criteria panel.